About
Hey, I’m Ryan, a Data Science Fellow at VoteHub. I’m 🇨🇦 Canadian and 🇺🇸 American.
At VoteHub, I sit on the data science team and the decision desk. I built a small but important piece of our midterm model, the first of its kind to carry precinct-level geospatial and ecological inference estimates for 175,000 precincts nationwide. More recently I built our Voter Power Index.
I also built VoteHub’s 2026 National Donor Map, bringing campaign filings and ActBlue and WinRed contributions into a county-level view of where House and Senate candidates raise their money. You can follow a race or candidate across the country, filter by contribution size, and switch between total dollars, net dollars, party share, and dollars per resident. My breakdown of the map looks at the small-dollar gap, the geography of giving, and how much campaign money crosses state lines.
Closer to home, I was the volunteer finance lead on Daniel Biss’s campaign for Congress in Illinois’s 9th District, which meant that for a while I saw the fundraising numbers I usually read in FEC filings from the other side of the ledger.
From when I was 7 or 8, my dad brought home Bloomberg Businessweek every week or so, as the name suggests. I would lift it off the newel post and read it pretty religiously; I think reading it changed my life.
In my free time, I like to shoot photos, go on long runs, swim for my team, and write on Expected Values, my Substack, where I published the DeepSky Partisan Estimator, a model that estimates precinct partisanship from satellite imagery and census data. I think onion futures should be tradable! DeepSky, along with most of what I build on my own or with friends, now lives at Cohese, a small lab for computational political geography that we hope stays as fun as it has been so far. That includes Shoal, a sampler that draws neutral redistricting plans on a laptop GPU many times faster than the standard tools, and Tessera, a free Mac app for drawing district maps and watching them in 3D, with precinct data for every state. I was a prolific politics and AI trader on Manifold, too, and still sit roughly in the top 0.25% of 160,000 traders by profit, with a 2.6 realized Sharpe.
I write things up in  because I think it looks cool and because Overleaf is better than Google Docs. Take a round trip in the wind, or read a motley crew of my quotes.
When I’m not doing any of the above, I’m a junior at Evanston Township High School.
Recently: the 2026 midterms
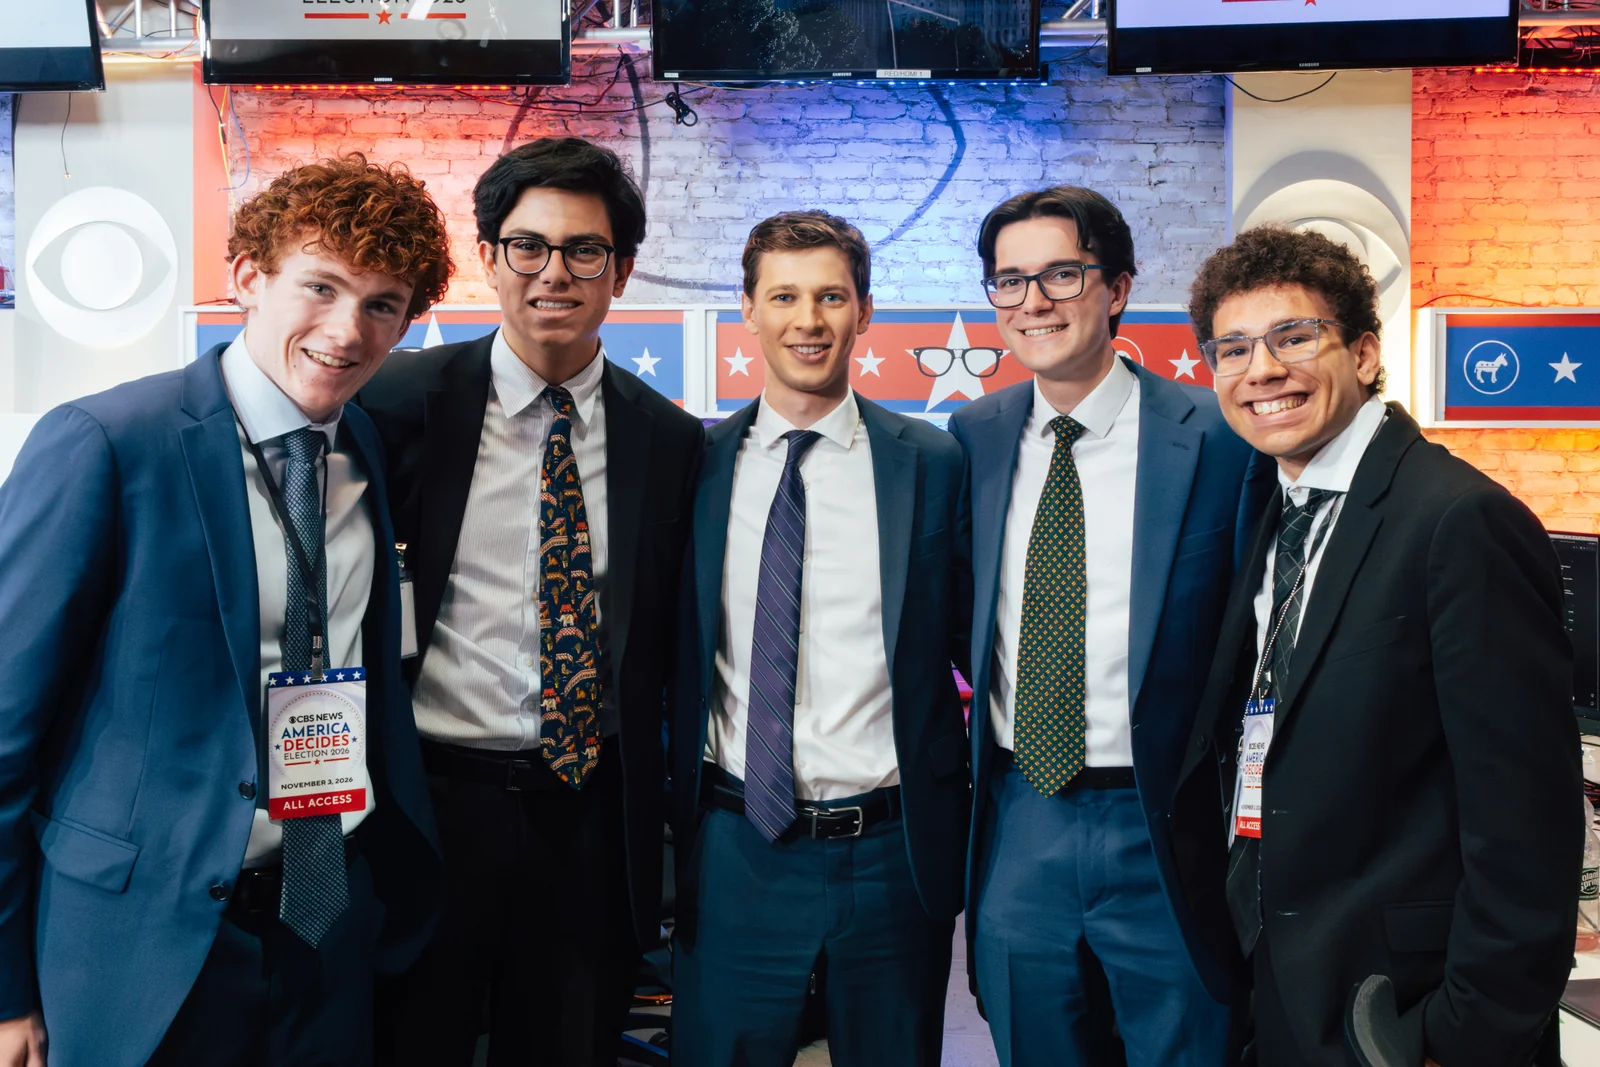
In my post-election recap, I shared two team results: our Legacy forecast ranked first by log loss, and our decision desk was first to call Senate control and the Senate races in Texas, Ohio, Maine, Michigan and North Carolina.
I also discussed the returns and the Voter Power Index on Northwestern News Network’s election-night show (my introduction starts at 33:40). There are more interviews and coverage on Press.
Nonexhaustive interests
- onion futures contracts
- satellite imagery, and how conducive it is to political geography and inference
- deep(ish) learning models
- elex and voting science
- multi-scale overlap averaging
- redistricting ensembles and chain sampling
- photography
- the efficiency of play-money prediction market sites
- the economics of inference and GPU time
- the future of how humans will interact with the world
- monetary policy, broadly
- Benford’s law
- the mech interp of Pangram’s AI detection models
Email: rymccomb1@icloud.com